Maker of the Optical Design Software OpTaliX
Geometric Analysis Capabilities
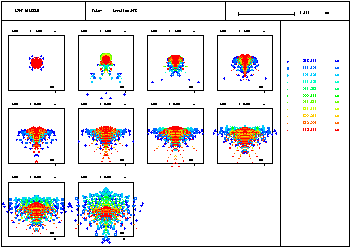 |
Spot Diagrams: Spots may be displayed vs. field, wavelength and zoom position, overlayed or separated. |
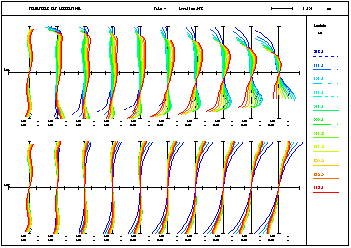 |
Rim ray aberrations may be shown as transverse ray aberrations or as the optical pathlength difference. Aberrations of multi-configuration (zoom) systems are plotted on one sheet, which provides an excellent overview (no need to plot each position separately). |
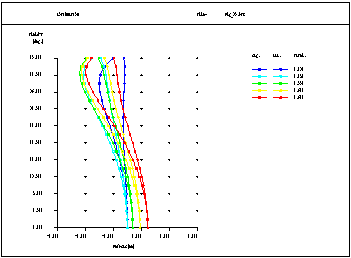 |
Astigmatism / Field Curvature The longitudinal field curvature plot yields an excellent picture of the correction of the Petzval curvature and the astigmetism. Shown for all wavelengths used in the optical system. |
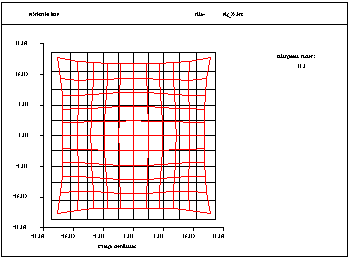 |
Grid Distortion: Shows the distortion of a rectangular object grid as imaged through the optical system. |
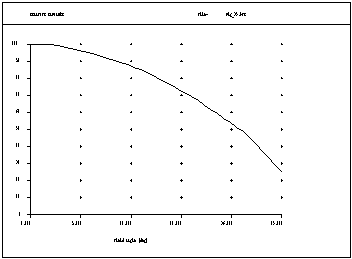 |
Vignetting: The vignetting plot shows the mechanical limitation or obstruction of oblique beams. It reduces the off-axis illumination in the image. However, it also plays an important role in determining the off-axis image quality. |
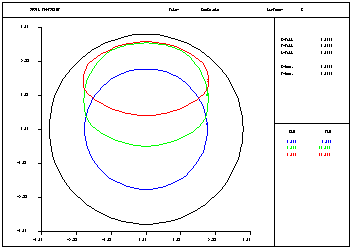 |
Footprint: Plots the used portion of the light beams at selected surfaces. Often used in conjunction with the vignetting analysis, since the plot shows how individual beams are truncated. |
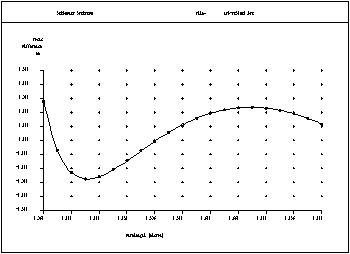 |
Secondary Spectrum: Longitudinal position of the paraxial focus as a function of wavelength, here shown for a decent apochromatic refractor lens. |
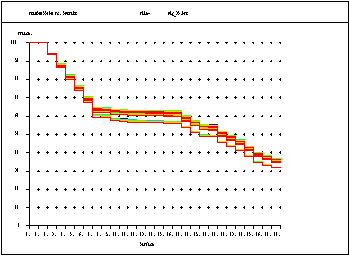 |
Transmission vs. Surface: Shows the contribution of each surface to the transmission losses in an optical system. Plotted for all fields defined in the system. The plot to the left shows a system with 13 lenses (26 surfaces). Each surface contributes between 4% and 9% to the transmission loss (depending on the index of refraction of a lens). The inner lenses are anti-reflection coated while the outer lenses are not. Transmission can also be plotted against wavelength or field. |
Overview
Examples
- Non-Sequential
- Special Apertures
- Gradient Index
- Hologram
- Zoom
- Array Surfaces
- Fresnel Lens
- Light Pipe
- Global References
- Geometric Analysis
- Diffraction Analysis
- Interferogram
- Physical Optics (350kb)
- Fibers
- Optimization
- User Defined Graphics
- Glass Manager
- Coatings
- Macro Language
- ISO Element Drawing
- Surface Deformations
- Ghost Image Analysis
- Illumination