Maker of the Optical Design Software OpTaliX
Diffraction Analysis Capabilities
Diffraction analysis in OpTaliX include:- Wavefront aberration vs. field or wavelength,
- Diffraction point spread function (PSF)
- Encircled/ensquared energy,
- Diffraction MTF vs. field, frequency, defocus and as 2-dimensional function,
- Strehl ratio vs. field or wavelength,
- Interferogram analysis,
- Zernike wavefront fit,
- Gaussian beam analysis,
- Coupling efficiency analysis.
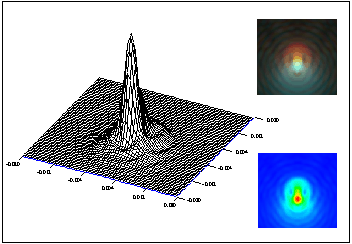 |
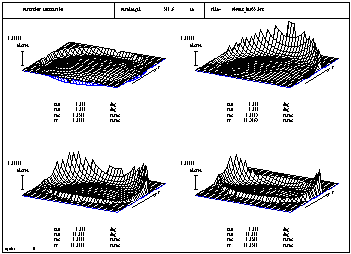
Diffraction Point Spread Function (PSF): The PSF is calculated by
FFT from the wavefront aberration. The ray density in the pupil may be
increased to improve the accuracy of the PSF. The PSF may be displayed
as perspective wire-grid plot, gray-scale intensity plot, false color
plot or "true" color plot. Not included in OpTaliX-LT |
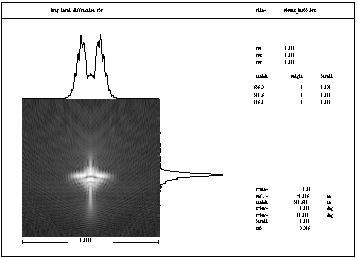 |
Diffraction Point Spread Function (PSF): Shown as gray-scale intensity plot. Not included in OpTaliX-LT |
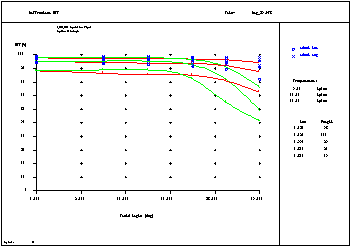 |
Diffraction MTF: The Diffraction Modulation Transfer Function (MTF) is computed by autocorrelation of the complex pupil function (derived from wavefront). It may be computed vs. field (as shown left), vs. spatial frequency, vs. focus position or as a 2-dimensional MTF at a given field number. MTF vs. field position is always shown for three spatial frequencies. Not included in OpTaliX-LT |
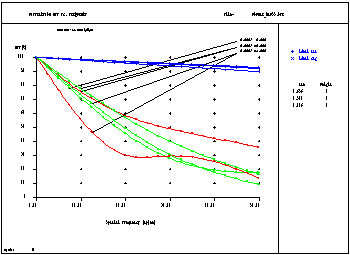 |
Diffraction MTF: As shown to the left, diffraction MTF
is plotted vs. spatial frequency for all specified fields. Not included in OpTaliX-LT |
 |
Wavefront: Plot wavefront aberration vs. fields or wavelength.
Vignetting is also correctly reproduced. Not included in OpTaliX-LT |
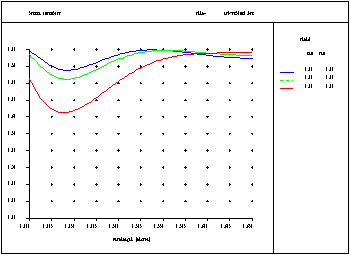 |
Strehl ratio: Plot Strehl ratio vs. field or wavelength.
The parametric plot to the left shows Strehl ratio vs. wavelength for a
typical apochromatic refractor lens, each curve representing a separate field point.
The blue curve is on-axis while the red curve is at a semi-field diagonal
of 0.5o. Not included in OpTaliX-LT |
Overview
Examples
- Non-Sequential
- Special Apertures
- Gradient Index
- Hologram
- Zoom
- Array Surfaces
- Fresnel Lens
- Light Pipe
- Global References
- Geometric Analysis
- Diffraction Analysis
- Interferogram
- Physical Optics (350kb)
- Fibers
- Optimization
- User Defined Graphics
- Glass Manager
- Coatings
- Macro Language
- ISO Element Drawing
- Surface Deformations
- Ghost Image Analysis
- Illumination