Maker of the Optical Design Software OpTaliX
User Defined Graphics
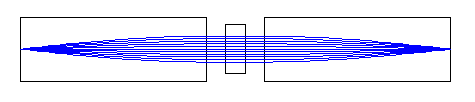
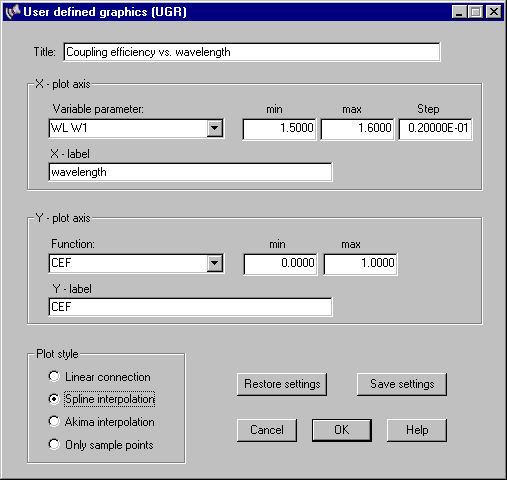
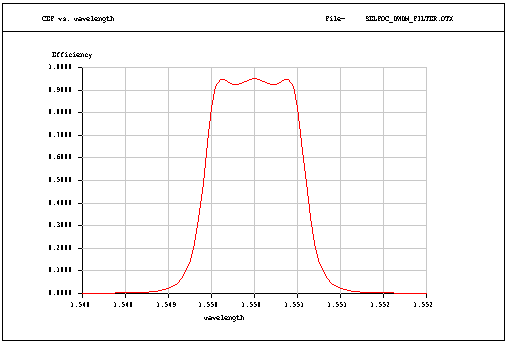
User defined graphics (UGR) are two-dimensional plots of any variable parameter against any performance measure available in OpTaliX. Parameters and functions may be any command, as it would be entered in the command line.As an example, coupling efficiency (CEF) in a DWDM photonics system is plotted as a function of wavelength. The system in use is a SELFOCTM fiber coupler with a 107-layer DWDM filter designed for 100 GHz channel spacing.
With transmission and polarization analysis turned on, the impact of the DWDM filter characteristics on coupling efficiency is clearly reproduced:
Overview
Examples
- Non-Sequential
- Special Apertures
- Gradient Index
- Hologram
- Zoom
- Array Surfaces
- Fresnel Lens
- Light Pipe
- Global References
- Geometric Analysis
- Diffraction Analysis
- Interferogram
- Physical Optics (350kb)
- Fibers
- Optimization
- User Defined Graphics
- Glass Manager
- Coatings
- Macro Language
- ISO Element Drawing
- Surface Deformations
- Ghost Image Analysis
- Illumination